I’ve said stocks are fairly valued, and my expectation of long-term yields and current stock valuations still justify that analysis. But like in George Orwell’s Animal Farm, some stocks are more fairly valued than others. I’ve looked into Warren Buffett’s picks for value ideas. But with so much cash to invest, he’s necessarily biased towards much larger companies. Therefore I did my own filters using P/E, P/Book, dividend yield and a minimum level of market cap.
I’ve come up with a list of 11 companies that look interesting:
- Archer-Daniels Midland (ADM)
- American Railcar Industries (ARII)
- Allianz (AZSEY)
- Caterpillar (CAT)
- Leidos (LDOS)
- RWE (RWEOY)
- Terra Nitrogen (TNH)
- Ternium (TX)
- Domtar (UFS)
- Volkswagen (VLKAY)
- Zurich Insurance Group (ZURVY)
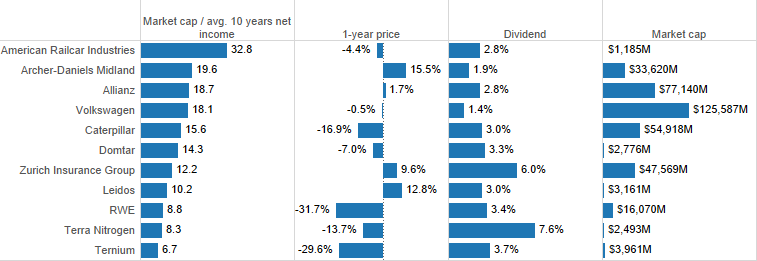
How do these companies compare? Using market cap per 10 years of earnings, Ternium, Terra Nitrogen, RWE, Leidos and Zurich Insurance Group all look quite cheap. Zurich Insurance combines value with a good-sized market cap. Terra Nitrogen pays a handsome dividend. Leidos is somewhat interesting, but the 10-year P/E flatters it’s earnings. In 2014 it earned a net loss. RWE & Ternium also look cheap, but with big 1-year price drops, I’d want to see how awful their trends are.
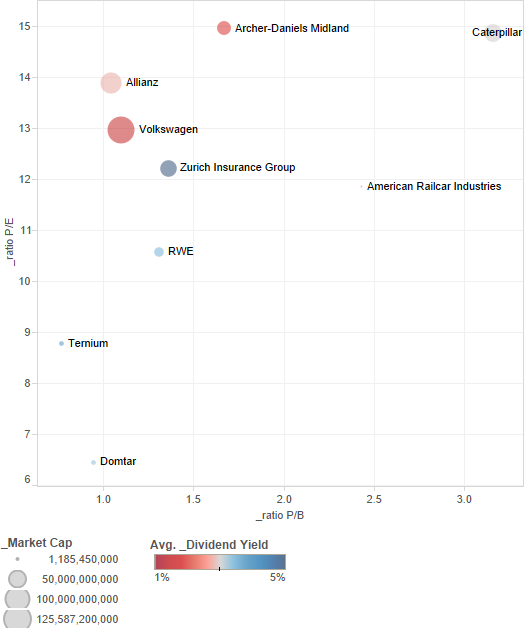
A quick scatter plot reveals some more interesting tidbits. Terra Nitrogen has a price/book ratio so high as to be an outlier (I’ve excluded from the below). It earns huge profit margins, which (according to my contrary logic) makes it riskier. Super-high margins will attract competitors, or will evaporate with changing natural gas prices. Otherwise, in terms of P/E, P/B and yield, Zurich Insurance, RWE, Ternium and Domtar stand out.
Let’s look at valuation trends over the last 10 years. Below is a dual-axis graph showing dividend yield vs. P/E ratio. What we’d want most are investments where yield is going up and P/E down. None of these stocks have such a pretty picture. Terra Nitrogen comes close. Zurich Insurance has a good yield (and decent yield trend), but it’s P/E ratio has been growing steadily as well. Ternium’s P/E bounces around a lot, but with a steadier yield. American Railcar and Domtar also have somewhat increasing yields combined with better valuations over time.

How are these companies doing in terms of sales & net income? Below is a similar visual, coloring the Great Recession gray. Since that time, Zurich Insurance sales have stagnated, but net income has increased. Alliance has seen stronger growth in both metrics, as has Caterpillar (except the last couple years) and American Railcar.

Let’s distill this information down a bit. From the above graphs we see that the:
- Cheapest stocks are Ternium, Terra Nitrogen, RWE, Leidos and Zurich Insurance Group
- Best-yielding stocks are Zurich Insurance, Terra Nitrogen, Ternium and RWE
- Safest stocks are Zurich Insurance, Caterpillar, Allianz, Volkswagen and Archer Daniels Midland
- Best performing companies are Terra, Zurich Insurance, Allianz, American Railcar and Volkswagen
- Best valuation trends are Terra Nitrogen, Zurich Insurance, Domtar and American Railcar
A portfolio of all these stocks should have a higher margin of safety than markets in general. But if you’re looking for value within value, the big winners from this analysis are Zurich Insurance Group and Terra Nitrogen.
Leave a Reply