With $106 billion to stash away, Warren Buffett’s Berkshire Hathaway (BRK-A) depends on making good financial decisions. If you’re a value investor and are fishing for good ideas, you could certainly do worse than to fish in the Berkshire pond as shown by this CNBC portfolio tracker.
But for me, a table isn’t enough, so let’s look at some graphs of Berkshire’s portfolio to see if we can spot Buffett’s more confident bets. Below is the same data as in CNBC’s tracker, but showing % of Berkshire’s total portfolio. Four main holdings stick out: Wells Fargo (WFC), Coca Cola (KO), IBM (IBM) and American Express (AXP). These four stocks account for more than 60% of BRK’s public portfolio.

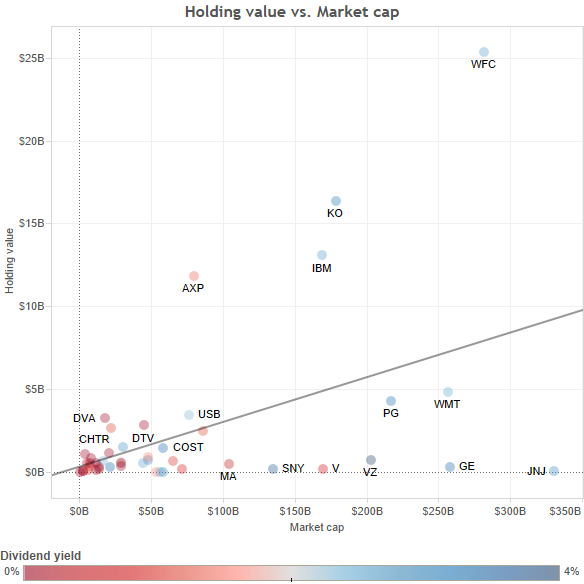
But with $106 billion to invest in public companies, of course Berkshire is biased towards larger companies. We can see this in the scatter plot below. The larger the market cap, the more Berkshire is likely to invest.
We can see something more. Anything above the regression line is a company that Buffett has taken a special interest in. Those below the line are, I’m sure, well analyzed and regarded. But I feel like with so much money, they are just safe places to stash a bunch of free cash.
We know that Buffett’s big bets are on American Express, IBM, Coca Cola and Wells Fargo, but what about smaller companies where he’s taken a special interest on a weighted basis? They include Da Vita Health Care (DVA), Moody’s (MCO) and Direct TV (DTV).
Maybe instead of just looking at what Buffett holds, we want to fish in his pond, but find particularly low P/E or P/B stocks that fit with our own strategies. Below are all the stocks in Berkshire’s portfolio (minus Moody’s because it’s P/B is a very negative outlier) by price/earnings, price/book and holding value (where the lines bubble).

If you want to focus on low-P/E companies that Buffett holds a lot of, then IBM, Wells and American Expiress are for you. If you like low-P/E companies regardless of holding percentage, then General Motors (GM), Chicago Bridge & Iron (CBI), Sanofi (SNY), Lee Enterprises (LEE) and Goldman Sachs (GS) stick out. Because Buffett doesn’t seem to seek out low price/book ratios like he does low price/earnings, I’ll leave that for another post.
To see how much Buffett likes companies with low P/E, have a look at the scatter plot below. As you can see, Berkshire’s biggest holdings are mostly under a forward P/E of 20. Coca Cola sticks out as a particularly large holding (and somewhat higher forward P/E), but it’s also one of those companies less likely to be upended, so more worthy of a higher valuation.

The companies off to the right are much smaller holdings, potentially riskier bets. I would look further into them out of sheer curiosity, but that’s a whole other post.
Maybe you’re into the value investing principles laid out by Benjamin Graham in The Intelligent Investor, and you want to pick your stocks, but you just don’t have the time to read five years of financial statements. It becomes more important to look in the right places. I hope the above visualizations have pointed out some interesting large and medium cap companies, vetted by the world’s great value investor.
Leave a Reply