With the latest jobs report, it’s starting to look like interest rates could be low for quite some time. For those of you who blame the Fed, you should really check out Bernanke’s new blog on why interest rates are low. For investors, the chase for yield is still on. One great place to find it is telecoms. Below is a value scatter plot of the world’s four largest telecoms companies. Because of massive past capital expenses, net income and P/E ratios don’t say much about valuations. So I’ve looked at Price/Book on the y-axis and Price/Free Cash Flow on the x-axis.
Softbank (SFTBY) and Vodafone (VOD) are having some free-cash-flow problems. Verizon (VZ), China Mobile (CHL) and AT&T (T) are all well valued compared to free cash flow. Verizon is the best on this metric, but looks overpriced per book value. All these companies offer tremendous yields except Softbank.
How do telecoms’ valuations look historically? The first four reached peak valuation (price/free cash flow) in 2006-2007. They then slid with the rest of the market to bottom out in 2009-2010. Now they’re rising again with the prospect of higher economic growth and lower yields. While they would have been a fantastic buy in the 2009-2010 bottom (like a lot of other stocks), they still seem well priced now as they haven’t reach their pre-crisis peaks. Verizon, with a price/FCF of just 14.9 looks especially attractive. But I wouldn’t rule out China Mobile at 20.4x FCF since the Chinese economy will likely grow faster than ours in the near future.
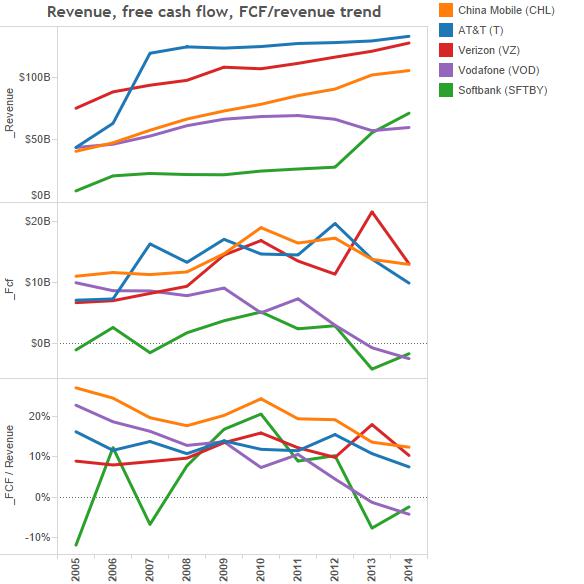
How are our telecoms doing in terms of revenue, free cash flow and margins? Take a look at the graph below. Verizon and China Mobile have the strongest long-term trends in terms of revenue. Vodafone and AT&T are struggling. Softbank has been doing better of late.
While free cash flow bounces around more, Verizon and China Mobile again look like winners. More disconcerting is the margin of free cash flow / revenue. Only Verizon’s trend looks healthy. The others are generating less free cash per dollar of revenue over time – a dangerous situation to say the least.
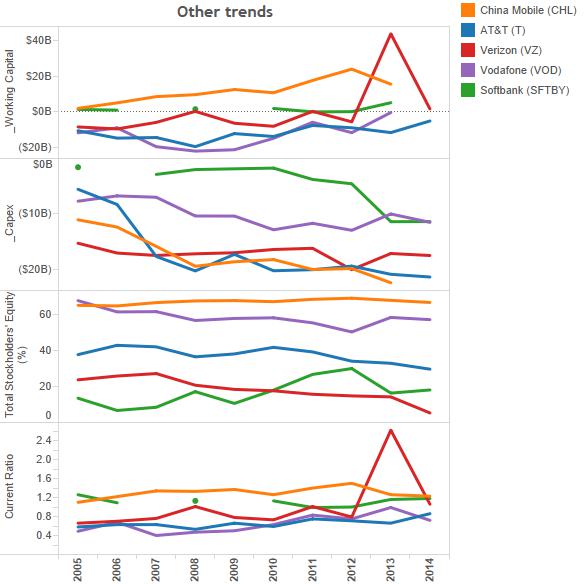
As far as other trends, Softbank has stepped up its capital expenditures (which accounts for its negative free cash flow). Most of our companies have a somewhat positive trend in working capital and current ratios. Only Verizon seems to have lower shareholder equity as a % of balance sheet over time.
Overall, these companies don’t look like they’ll grow a lot in the near future, but they do generate huge amounts of cash, pay a lot of that cash to shareholders, and appear to be strengthening their financial positions. If you want a riskier value play trap, Vodafone looks cheap trading at 84% of book value. But with negative cashflow and a marginal revenue trend over ten years, I would steer clear.
Even with its much higher price/book ratio, Verizon looks to have the healthiest trend growth in revenue and free cash flow. Trading at just under 15x free cash flow, and with a dividend of 4.4%, this is a stock I’m certainly considering. However, from my previous sector analyses, I do think the car industry and banks offer a better combination of value with potential growth.


Leave a Reply