What drives stock valuations? Is it corporate earnings expectations? Overall economic growth? Treasury yields? I’ve gotten into a few debates about the relationship between treasury yields and valuation metrics. The problem is always causation. Do low interest rates cause people to pour money into stocks in a chase for yield? Is high inflation harmful to valuations because of higher capital gains taxes? As always, I prefer actual data to see what happened in the past.
Below are four metrics graphed from 1928-2015. Instead of PE and CAPE, I took the inverse of the two so we could compare percentages: expected yields on stocks vs. expected yields on bonds vs. expected nominal economic growth. If you could get Robert Shiller, Warren Buffett and Scott Sumner in a room to argue about financial securities valuations, this is the graph they would look at:
What do the data say? Well, it depends on the year. Before 1960 it looks like stocks have lower valuations (remember, we’re looking at inverse PE’s) when treasury rates are low. This seems odd, especially since after 1960 all the yields follow each other as expected.
For a plausible answer, look at NGDP growth before 1960 (gray line). It is literally off the charts up and down with the Great Depression, World War II, post-World-War-II collapse and 1950’s reflation and prosperity. To me, this makes an interesting case that volatility (and political uncertainty) affects equities prices. As volatility in economic growth goes off-the-charts up, treasuries yield less and stocks are less attractive (stock prices yield more as treasuries yield less). Indeed, in a long-term economic collapse or a war, you’d expect treasury yields to be low and equities investors to demand more yield.
What about after 1960? Once the Federal Reserve finally learned the lessons of the Great Depression, we had more stable NGDP growth after 1960. There was growing inflation until the early 1980’s, then compression since. But because the economy stayed in a normal range, the yields of stocks track well to treasury yields. If treasury rates went up, stock valuations dropped, and yields on equities jumped to match higher treasury rates (assuming treasury rates are the cause).
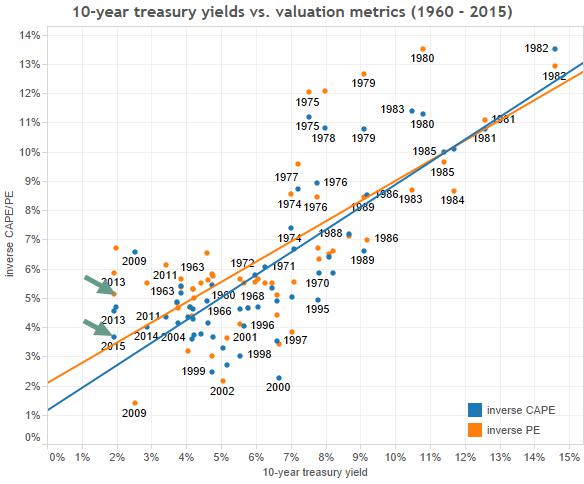
Below is plot of the relationship between 10-year treasury yields and inverse PE/CAPE. As you can see, in 2015 inverse PE/CAPE is historically low (as valuations are historically high). But compared to the regression lines, they aren’t as low as treasury rates would dictate they should be. To get back to the trendline, either stock prices would need to advance, or treasury rates will have to rise.
By how much? According to the equations that determine the below regression lines, if treasury yields remain the same, stocks would have to rise by 41% (per CAPE) or 51% (per PE).
Given current market psychology, this seems unlikely. More probable is that interest rates will adjust. To get back to trend at current PE/CAPE, 10-year yields would need to rise to 3.3% (per CAPE) or 4.4% (per PE). This doesn’t seem completely unreasonable, but look at historical trends. The last time 10-year yields were under 3% (aside from a blip in 2009) was in 1956. But they had been under 3% for 21 years (since 1935).
Just because we had gotten used to 5%+ 10-year yields pre-2001 doesn’t mean those rates are normal. Look at average rates since 1871 below. The average 10-year yield over the entire time period is 4.62%, the median rate 3.9%. It seems likely that ultra-low rates may be the new normal for quite some time. Which means high valuations are also here to stay.
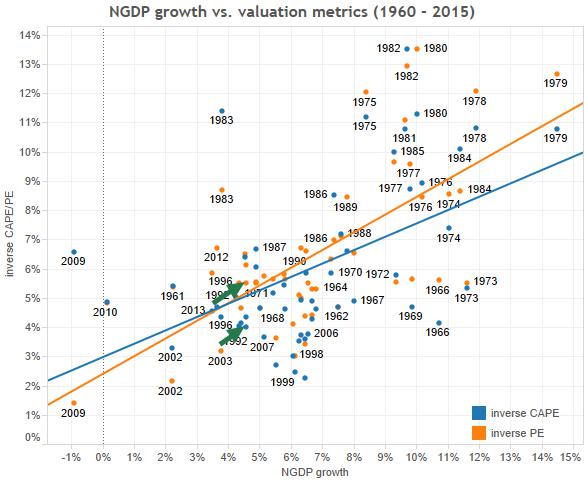
What about NGDP growth? Like interest rates, NGDP correlates to the inverse of PE/CAPE. This makes less sense. Faster NGDP growth should mean faster-growing corporate profits should mean higher valuations (and lower stock yields). Why would investors demand more from stocks when the economy is growing more quickly?
I think this brings us back to the chain of causation. Is higher expected future demand leading to higher PE ratios today? In the past fast NGDP growth led to lower PE ratios. It seems that what really happens is that higher demand leads to higher interest rates, and those higher interest rates drives demand for higher returns on stocks (and lower PE ratios).
What does that mean now? There are three scenarios:
- Interest rates stay low for a long time, but the Federal Reserve tries to keep a floor under demand so that it doesn’t collapse as in 2008
- The Fed tightens in the short term leading to a collapse in demand, and we’re back to lower rates for the long haul as the Fed relearns its lesson, yet again
- The Fed actually lets inflation go over 2% and NGDP reaches it’s trend level of growth. Interest rates would finally adjust to a higher level to reflect the balance between savings and credit with faster-growing incomes.
Scenario 1 means we’ll see stocks at current valuations for a long time, but returns will also be low. With risk-free returns at 2%, we won’t see stocks return more than 4-5% per year. But compared to the alternative, stocks are priced fairly. Scenario 2 would likely mean a quick collapse followed by a quick rebound in share prices. Scenario 3 is best for the economy, but still good for stocks. Even though it’s the only scenario where stock prices might be considered overvalued by our regression lines (because interest rates would overshoot 3%-4%), there needs to be a lot of NGDP growth to get to a point where interest rates are consistently at that level. With that much growth, presumably the denominator in our PE ratio would rise quickly enough to bring share investors enough yield to compensate for holding stocks rather than bonds.
So why are stocks failing to correct to their fair value? Because with interest rates where they are, and with little reason to think they’ll go much higher in the near future (except with exceptional economic growth), stocks are at their fair value.


Leave a Reply