By trade I’m a digital marketing analyst, even though a lot of my work is moving to general visual analysis. As you can tell from this blog, I have a heavy interest in value investing and monetary economics as well. But I’m going to go back to my day job for a few minutes to show any bloggers (or other small businesses) some basics on how to use Google Analytics in tandem with connecting your content to the rest of the web. After all, if you want traffic, referrals from other blogs are a great source. Eventually those link backs will help your organic search rankings.
Step 1: where is your traffic coming from?
Yesterday I noticed a spike in referral traffic to my blog (which is still fairly new). So I looked in the left-hand navigation at Acquisition > All traffic > Source/Medium to see where it’s coming from.

I see, wow, this is from TheMoneyIllusion, a blog I love. But what if I want to know a bit more? Like which article did theMoneyIllusion link to so I can thank them? Then I just do a secondary dimension and type “page”.
Step 2: where did a big source link to?

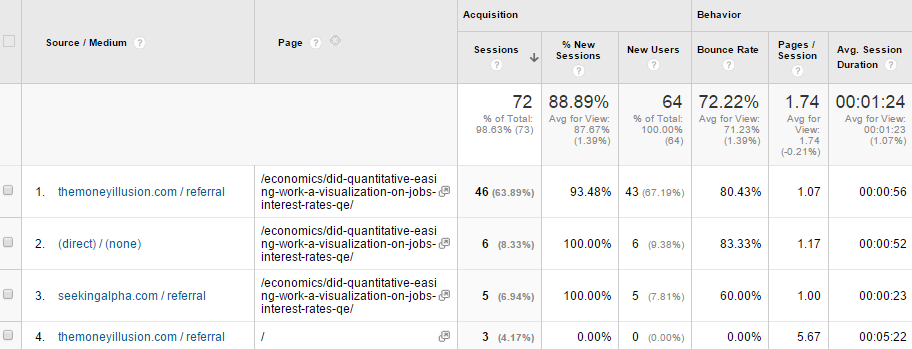
Now I can see that TheMoneyIllusion linked to my post about whether quantitative easing worked:
Step 3: Anyone working somewhere interesting viewing a particular article?
This is where things get a bit creepier. If you have a LinkedIn profile, you can see 3-6 people who last viewed your profile with the free version. With Google Analytics (also free), you can check out the network that hit your page (note, with a marketing automation platform like Marketo, Eloqua, Pardot or Infusionsoft, you can see visitors’ activities so long as you get them to submit a form — but these platforms can be costly).
In Google Analytics, go to Audience > Technology > Network.

You’ll probably want to sort by pages per session or time per session to see the most active visits. You’ll get a lot of generic networks like Comcast. But you’ll also see some visitors’ office networks (I’ve underlined them). Now I know that someone at BNP Paribas looked through 4 pages and spent over 2 minutes on my site. Another visitor from the Federal Reserve Board looked at 3 pages for just over a minute.
This is very basic Google Analytics reporting that you get just from adding an out-of-the-box tracking script on your website. Just by occasionally perusing these reports, you can know who to thank for re-posting your work, and also get a flavor of the sorts of visitors you’re attracting.
Leave a Reply