Whenever I’m scouring the markets for investment ideas, I try to fish in pools where there’s value rather than growth. For example, when using Google’s stock screener, I’ll look for low P/E ratios, low price/book ratios, low price/sales ratios, large 52-week negative declines, a reasonably-sized market cap and decent dividends. Maybe all of those will apply, maybe just a couple. If Warren Buffett happens to own a stock, I’ll give it extra attention as I know the management will probably be top-notch. At the moment, I’m avoiding energy stocks since their currently outstanding ratios are based on a period of high energy prices (and who knows whether the low or high prices was the outlier).
After finding a few good prospects on Google, it’s over to Morningstar to figure out if a stock has the right history for me to buy. Let’s use HSBC as an example.
Quote tab, what to look for:
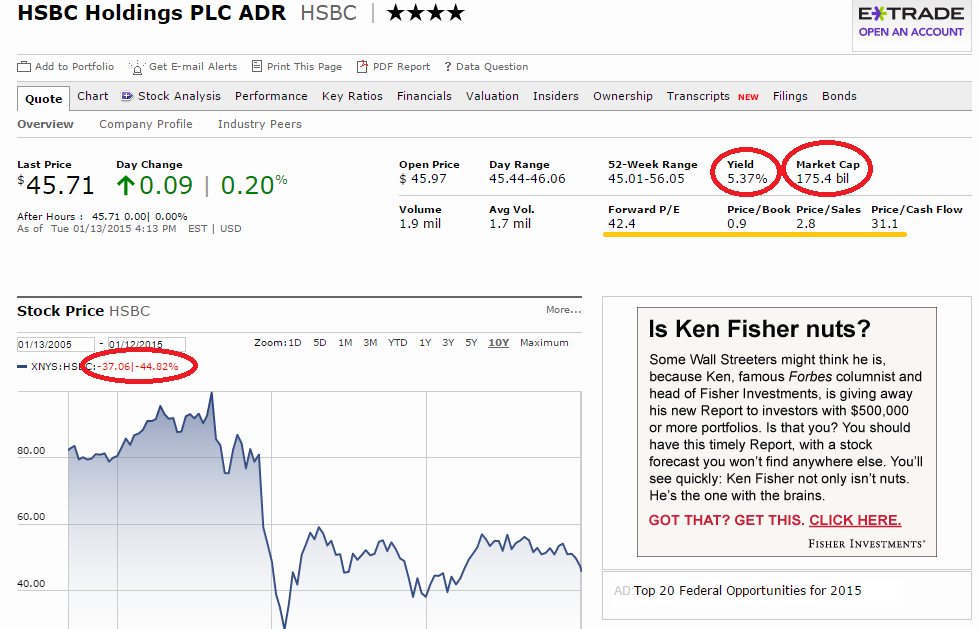
- Ignore the price per share of the stock. It means absolutely nothing. Instead, you should focus on the market cap (how much you’d have to pay to own the company outright), the yield (how much you’ll likely earn if you hold this stock like a bond), and the 10-year price (make sure it’s not too pricey)
- What does the tab below say?
- HSCB market cap = $175 billion. Remember that number because that’s the real price of the stock. Otherwise, it’s a large cap, so probably offers some degree of safety in a highly-fluctuating market.
- Yield = 5.37%. In a world where 10-year treasuries pay 2%, this is a great “safe” return on investment. But the reason HSBC is yielding so high is likely the price trend over 10 years, which has been terrible.
- 10-year price = -45%. In a market that seems overvalued, this looks good to me, but beware. There will be reasons HSBC has done so poorly over the last ten years. But also know that past history does not equal future performance. It’s hardwired into the human brain to project out from the past. We love patterns, but we simply don’t know what the future holds for any company.
Key ratios tab, what to look for:
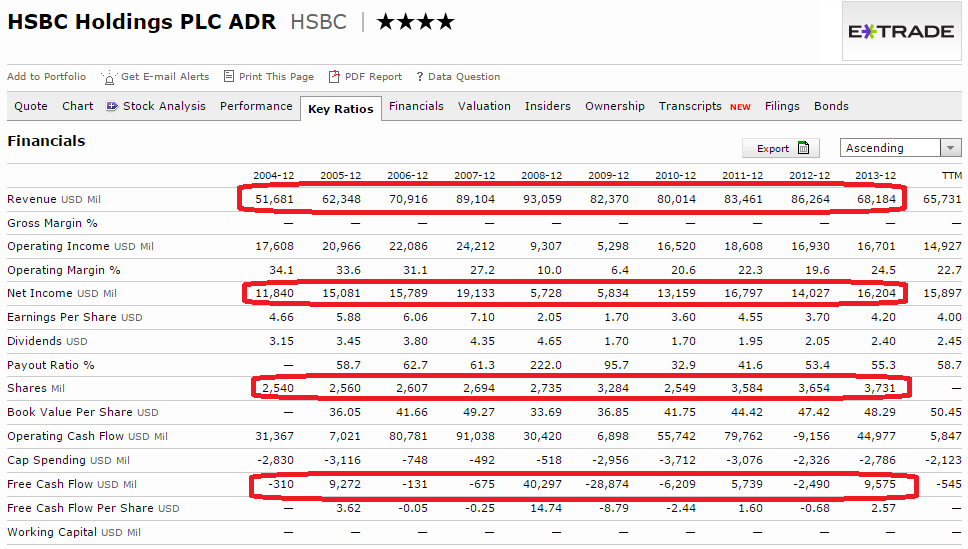
- Revenue: What does the top line say about HSBC? It looks like it was growting until 2012, then shrank in 2013, pretty drastically at that. Why?
- Net income: Net income appears fairly healthy, especially compared to our $175 billion market cap. It seems likely that HSBC will return 10% on it’s market cap as net income, ignoring the financial crisis years of 2008-09.
- Shares: Is HSBC issuing a lot of shares over the years? The answer is yes. This is a red flag as may may need to expect your holdings to be diluted over time.
- Free cash flow: This looks fairly uneven, which is fine. But HSBC generates a ton of operating cash, then spends a ton (unevenly) in capital expenditure. Why?
Financials>Cash-flow tab, what to look for:
- Common-stock issued: If HSBC issues more common shares, you lose money if you’re an owner. It looks like in 2009, that’s exactly what happened (to the tune of $18 billion).
- Repurchase of stock: There are no repurchases worth mentioning, but this would be money you could expect to get back from the company.
- Dividends paid: Again, money you expect to get back. Net income can be faked. To some extent, share repurchases can be faked (if the company issues more shares back out, or uses shares as compensation). But you can’t fake a dividend. Well, maybe you can if you’re issuing more shares now simply to pay off current shareholders.

Financials>Balance sheet tab, what to look for:
- Just like it’s harder to fake cash flows than net income, it’s also harder to fake a balance sheet, so pay attention.
- Total assets: HSBC is adding to its assets. Of concern is that it holds almost $2.7 trillion in assets.
- Total liabilities: Liabilities are also growing, albeit more slowly than assets. Again, HSBC has a crazy $2.5 trillion in liabilities. On the plus side, there’s likely a government guarantee against HSBC’s failure because of it’s sheer size.
- Equity: The size of equity vs. assets is worrisome, but this number has grown by $43 billion over 4 years.
Putting it all together, HSBC is valued by shareholders at $175 billion. It earns a steady-looking $15-$16 billion, or a respectable 8%-9%. Free cash flow looks worrisome, but this may be from fines from the financial crisis. This requires reading HSBC’s annual reports (not everything is in Morningstar). But we want to know how much HSBC is returning to shareholders. And the only ways a company can return money are through stock repurchases, dividends or increasing equity.
Looking at cash flows from investing activities, HSBC issued a massive $18 billion in new stock in 2009. But since then, it has been issuing a much smaller $300 million a year or so, compared with $5-$7 billion in dividends. And HSBC’s equity has increased by $34 billion over the past 3 years. This sums roughly to:
- -$300 million for stock issued (ignoring the big capital infusion of 2009 required by the crisis)
- +$6 billion in dividends
- +$10 billion in increased shareholder equity
Adding those all up results in $15.7 billion returned to shareholders each year over the last three years. Compared to $175 billion in market cap, around 9% (not bad in the era of 2% treasury yields). But further research is required into 1) why HSBC’s sales has declined, 2) why HSBC has so much capital expenditure and 3) whether HSBC is well-capitalized enough to avoid massive share dilutions in the future. The overall picture so far suggests that HSBC is an undervalued giant that will generate a healthy dividend income.


Leave a Reply