In this article, Paul Krugman uses a simple scatter plot of government spending vs. real GDP growth to prove that austerity doesn’t work. In his response in Forbes, Benn Steil invokes Scott Sumner, reproducing Krugman’s graphic without Eurozone countries. The thought is that monetary offset negates fiscal stimulus. Steil believes you should exclude countries without control over their own monetary policy to really see if austerity works.
Both are missing the point. By using Eurozone-centric data, Krugman is arguing that austerity doesn’t work and we should spend our way out of depressed conditions in the United States. But with control over our own monetary policy, presumably fiscal stimulus would be offset by our independent central bank. Steil glosses over the Eurozone as an interesting case study of, when monetary policy is the same across a group of countries, would increasing levels of fiscal stimulus then work to spur economic growth?
Let’s start with my own scatter plot using World Bank data: all OECD countries since 1962, excluding extreme outliers and looking at per capita GDP growth vs. change in government spending. As in Krugman’s graph, the correlation is easy to spot, the relationship is significant and the r-squared is 11% (small, but meaningful).
Like in Krugman’s graph, there are two lies (1 & 2 below) and a 3rd I’ve introduced:
- We’re ignoring varying monetary policy regimes: Some of those points are countries in the Eurozone or countries with a currency pegged to the US dollar. Without control over monetary policy, would the correlation be stronger or weaker?
- We’re ignoring causality: if government spending increases in the same year real per capita income also increases, that doesn’t mean the spending caused the income increase. In fact, the opposite could easily be the case (we’re richer, so we spend more on government projects). Or the relationship could be an accident. Developed countries seem to grow more than they shrink, and they also tend to increase government spending. Maybe neither causes the other.
- Different times may call for different policies: In my quest for more data (that scatter plot shows 1,499 points), I’ve gone back further in history. But there may be certain times when fiscal stimulus would work (like our recent depression) and those where it wouldn’t (like the high-inflation 1970’s).
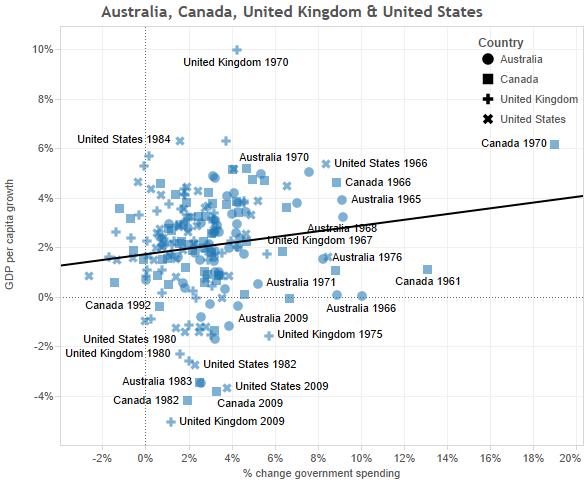
First let’s deal with the 1st lie. If we restrict our analysis to like economies with independent monetary policies, maybe we can tease out whether fiscal stimulus works in a country like the United States. Below I’ve taken data from just Australia, Canada, the United Kingdom and the US. It does look like, for the full time period, fiscal stimulus has a significant relationship with GDP growth, but without a good model for the relationship between the two.
For the second “lie” (what causes what), let’s look at just the United States over time. From the below, in most cases the GDP per capita growth precedes the change in government spending. Which means Krugman may be completely wrong about the direction of causation (at least in the US). Instead of fiscal stimulus spurring the economy, higher growth seems to spur government spending. In Krugman’s defense, the rise in government spending 2009 does come before the return to growth a year later.
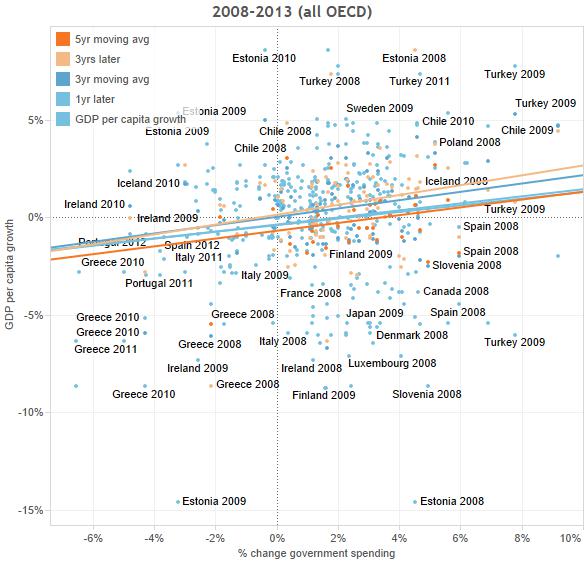
Let’s now take two of the lies together – 2) causation and 3) timing. below is a scatter plot with one independent vs. five dependent variables, but only for the latest, depressed economic period.
We appear to get 5 positive relationships between government spending changes and current/future GDP per capita growth. The deviations from the regression lines are much wider, but the relationships are still significant.
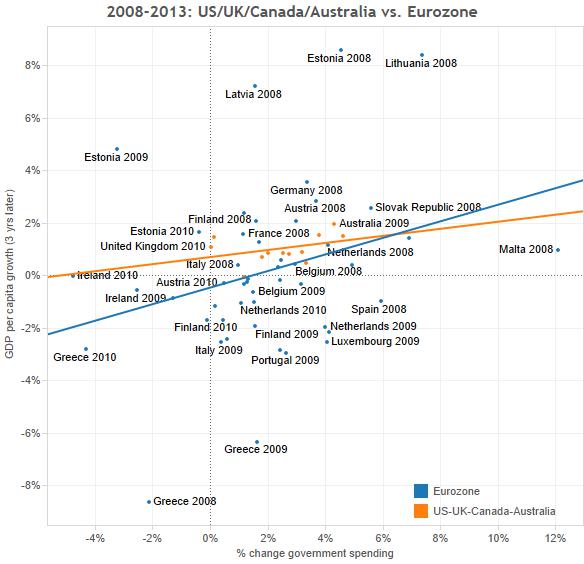
What about different policy regimes? Below we look at change in government spending vs. GDP per capita growth 3 years later. And we divide them into “Anglo” zone (US, UK, Canada & Australia) vs. Eurozone. This is our “test” of fiscal stimulus in countries with/without control over their respective monetary policies.
What we find is what we’d expect. In the depressed period from 2008 – 2013, countries without control over their own monetary policies (Eurozone) had more per capita GDP growth 3 years later if they increased government spending. This relationship is significant with a 9% r-squared. And the slope of the line is higher than countries that do have independent monetary policies (the “Anglo” zone). The relationship for “Anglo” countries is also positive, but not significant.
In conclusion, both Krugman and Steil are right. If you have your own monetary policy and use it, then fiscal stimulus appears to have less affect on economic growth. But if you don’t have your own monetary policy, then fiscal stimulus does appear to work, at least compared to the austere alternative.


“We appear to get 5 positive relationships between government spending changes and current/future GDP per capita growth. The deviations from the regression lines are much wider, but the relationships are still significant.”
A first, and minor problem, with this analysis is that the economy is cyclical, you can’t really distinguish forward lags from backwards lags. In fact, you didn’t even include backwards lags.
A major problem is that anything you do in a recession will eventually be followed by a recovery, so if governments simply consistently increase spending in recessions, that will seem to correlate with future growth even if there is no causal relationship.
Another major problem is that the variables clearly are dependent in other ways; for example, Greece couldn’t have strongly increased government spending given its recession and Eurozone rules, but that causal relationship that says nothing about the relationship between spending and growth.
Most importantly, the number of samples (in particular for Anglo-zone countries) is too small to be meaningful; try doing a Bayesian analysis and plotting the confidence region for the regressor and the r value. In addition to the small number of samples, you should probably also include +/- 1 year variability in the timing of the government spending, and +/- 20% in the amount.