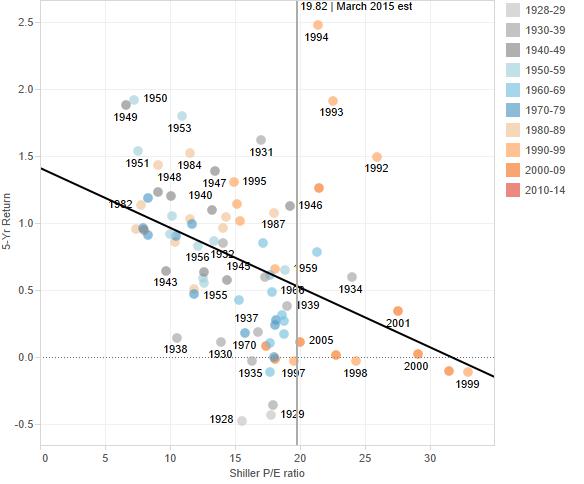
Do high P/E ratios scare you? In a sense they should. The average Shiller P/E of the S&P 500 since 1928 is 16.75. Now it stands at 19.82. That implies the market should drop 16%, or earnings will have to make up the difference. In a past article I look at the same scatter as below, but only going back to 1955. Adding data to 1928 makes the correlation significant. High P/E ratios lead to lower 1-year returns (though you need to exclude outliers 2002 and 2009).
The relationship in the above graph isn’t strong, but look what happens when you look at 5-year returns. Our r-squared (the amount the trendline predicts 5-year return) is up to 17%.
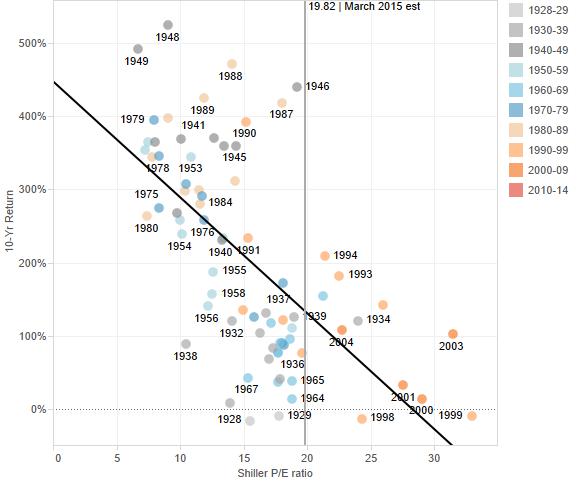
Comparing against 10-year returns below, r-squared jumps to 41%. A high P/E has been very good at predicting 10-year returns. Not surprisingly, the higher the P/E, the lower return you can expect over 10 years.
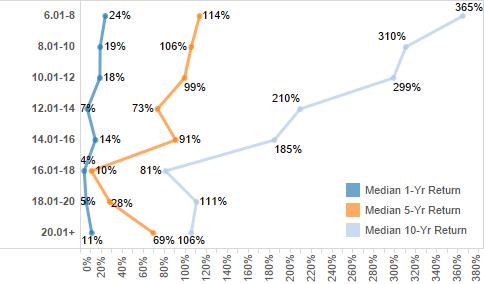
But is the story bad enough to jump into bonds with their extremely low yields? The answer is no, and this is a big reason why the market is high now. Let’s look at a distribution of S&P 500 returns (the median year) by ranges of P/E ratios.
The median return drops as P/E ratios get higher, but notice it never drops below zero (even within 1 year). The median 10-year return never drops below 81%. If you invest everything in the market now, and returns follow the median of P/E from 18.01-20, you’ll end the next ten years with more than double your money (111% more in fact). But some starting years have offered negative five- and ten-year returns.
Below is the same distribution, but with years broken out. In the sample of years since 1928, only six starting years offered significantly negative returns over five years. Three were during the great depression and one was at the height of the dot-com boom. For negative 10-year returns, you would have had to invested in 1928/1929 or 1998/1999.
But instead of focusing on the negatives of these graphs, look at all the positive five- and ten-year returns offered in years with high P/E multiples. It’s not as sure of a thing as a very low-P/E year, but when compared to 2% 10-year treasuries, I’ll take my chances. Plus there are sectors where P/E ratios don’t look particularly high.
Ty Cobb had a batting average of .366 over 24 seasons. As a kid I loved to think all those great, old-time hitters could have done the same today. Now I know better. Baseball has become more inclusive and more competitive since Ty Cobb’s time. Sure, he was an outlier then and would do well today. But with more competition, he wouldn’t have been off-the-charts good.
Notice how a lot of those outsize returns / low PE years were a long time ago. With more history of market returns behind us, more information right at our fingertips, it’s hard to find the same deals as in the past. This is especially true with interest rates so low, and set to stay there unless the Federal Reserve can raise our inflation expectations. Add in the fact that low-cost ETF’s are allowing small investors to bundle their risk, and of course valuations are higher now. P/E ratios don’t always revert to historical averages. In the last couple crashes they haven’t.
American stocks are a great buy. They may not give us the amazing returns of the past, but with patience you’ll do far better than holding cash or bonds. So be patient and enjoy the ride.


Leave a Reply