Markets have been rather tetchy recently, and analysts are scratching their heads. Is it the price of oil? The Swiss National Bank’s ditching of the Euro peg? Nervousness about a bubble in stocks, dangerously inflated by loose monetary policy?
The reason for historically high P/E ratios is indeed low interest rates, but not because monetary policy is too loose. Rather, monetary conditions have been tightening recently, and market volatility reflects fears of outright deflation.
First off, what does it mean that monetary conditions are tight? It means that our expectations of nominal GDP growth are lower, and thus we collectively reduce our spending to pay down debt. The graph below shows the relationship between the S&P / NGDP ratio and NGDP growth. You can’t miss the negative correlation (lower NGDP growth = higher stock values), mainly because interest rates are so low. But the stock market crashes that occurred in the early 2000s and 2008 both happened amid sharply lower NGDP growth. While stable, low NGDP growth raises valuations, tanking NGDP growth drags everything down with it.
Below is the same graph, swapping 10-year treasury yields in for NGDP growth. Since 1980 there has been a secular increase in the ratio of the S&P 500 / NGDP (this is also true of the CAPE). What’s going on? Interest rates are ratcheting ever lower because monetary conditions have been compressed further and further. Paul Volker broke the back of inflation, then subsequent monetary policy pushed nominal growth down to where we are now, meaning we’re much happier with lower rates of return. There just aren’t the investment opportunities in a low-growth environment to drive our expected RoR higher.
The relationship between interest rates and S&P/NGDP models quite well. The r-squared is 51%, meaning the equation that draws the trendline below could be used on one variable to predict the other with 51% accuracy, not bad for a statistical model. It also looks like the higher the interest rate, the tighter the year hugs the trendline, with stock prices in the 1980s being somewhat overvalued compared to the regression. The lower the interest rate, the more stock price / NGDP bounces back and forth. Lower interest rates can signal either low, stable inflation or a coming crisis of confidence in the ability of our central bank to support demand. For 2014, we’re actually to the left of the curve, meaning stocks would have to go up to satisfy the regression line.
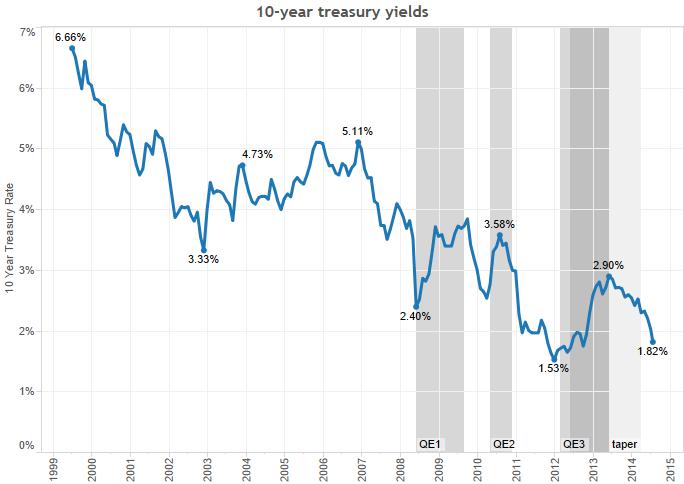
What now? For that we need to see how expectations of inflation are changing over time. As a stand-in, at what rate are investors willing to lock away their savings for 10 years? Below is the answer – 1.82%. The 10-year treasury yield actually jumped whenever the Fed did a new round of QE. This makes little sense unless you think of how the Fed is changing inflation expectations. Investors expected faster NGDP growth during times of QE, then moved back to treasuries after the Fed stopped. During the taper, 10-year treasuries fell slowly. Now they’re falling more rapidly without Fed bond purchases.
What does this mean for stocks in the near future? If investors remain convinced that the Fed will step in if demand slows too much, then stocks seem fairly valued and will remain so. A correction will happen only if inflation expectations go up enough to seriously push up treasury rates. That’s not going to happen anytime soon. But if demand shows signs of dropping, and the Fed faces too much political pressure to raise our inflation expectations, then markets will be in for a very rough ride.


Leave a Reply