As a value investor, I want to find stocks that trade at good ratios: P/E, price/book, price/cash flow, etc. But I also understand that the market is trading at higher-than-average ratios because of low interest rates. The car industry is one that looks more fairly valued. Just look at the median ratios of the major car companies below (included are BMW, Daimler, Ford, General Motors, Honda, Nissan, Renault, Tesla, Toyota & Volkswagen).
P/E ratios spiked during the recession, but have since dropped back to their pre-recession trend. The same is true for price/sales. Median price/book is lower even than before the recession, while the current ratio has improved. How have stock prices evolved for these companies?
All show a steep drop in 2009 (except Volkswagen), then recover to around pre-recession levels. Tesla has been an exception as it zoomed higher and higher over the last two years. Honda, Renault, Volkswagen & GM stand out for being losers over the last year (which makes me like them more).
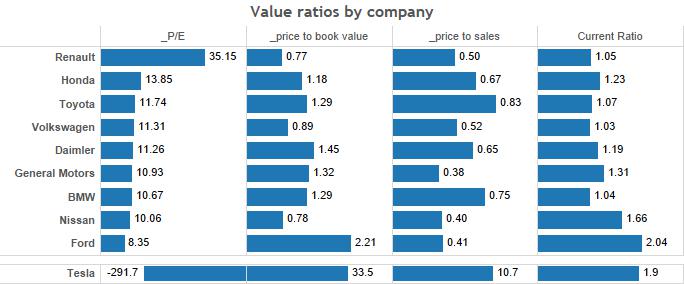
For a multivariate analysis of ratios, the graph below shows P/E, P/Book, P/Sales & Current Ratio. I had to quarantine Tesla because it’s valuation multiples are so off the charts as to defy any sort of reality (short sell opportunity?).
P/E ratios look pretty similar (Ford & Renault are the outliers: Ford doesn’t have as much built-up equity because it survived the American financial crisis without the shelter of bankruptcy. Renault has struggled in the past year, but looks solidly valued according to its other ratios. You may worry about Ford’s lack of equity, but it has a terrific current ratio. Nissan and Volkswagen stand out as companies where two ratios (price/book & price/sales) are suggesting that these are bigger companies hiding beneath smaller valuations.
Next we move to dividend yields. You may use financial trickery to fake net income, maybe cashflow, possibly balance sheets, but it’s very hard to fake a dividend year after year.
The future is unknowable, but we can see the trend in dividends looks pretty good for all our companies save Honda. Toyota, Volkswagen & Honda are the only companies to have paid dividends over the whole period. The trends for BMW, Nissan, Ford & Toyota look promising.
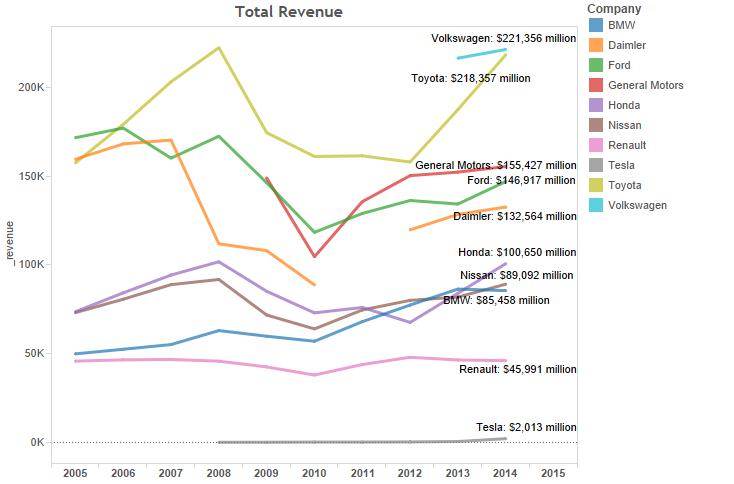
Total revenue is strong for all the companies in the industry (except Renault). Toyota & Honda are showing strong 3-year growth.
As for free cash flow, Toyota is the clear winner here. GM looks like it’s becoming an engine of free cash flow as well. Honda’s 17% stock price drop looks more understandable in light of it’s negative free cash flow (from very high capital expenditures).
Net income trends look healthy for the entire group (Renault, Volkswagen & Tesla are the exceptions). Toyota is a powerhouse. Honda looks a lot better in terms of net income than free cash flow because of it’s ultra-high capital expenditures. The question is, will those investments pan out in better technology, lower manufacturing costs, more differentiation and increased margins? Only time will tell.
P/E ratios over time give us an interesting look at the industry. For the most part, they have all converged around 10, with Honda & Toyota trading somewhat higher than average, and Ford & Nissan somewhat lower. Renault’s recent profit troubles have pushed it’s P/E sky-high.
Price/Book ratios are more stable with the exception of Ford, whose survival of the financial crisis pushed it’s leverage to the edge, though now it is generating tons of equity. Ford’s reinstatement of dividends should look more secure over time as its book value continues to grow.
Days inventory might be an interesting look into whether one of our companies is struggling to sell cars. There don’t appear to be any bad trends in recent years. Renault & Honda have lowered their days inventory in the last few years. In Renault’s case, this may be an omen of lower sales rather than better management.
The below scatter plot attempts to show three variables in one spot. The best-valued investments will be those closer to 0 for both variables, but not negative. Greener also indicates a higher current ratio. Ford & GM produce a lot of cash compared to valuation, though Ford has a very high price/book (though moving in the right direction). Nissan has a great price/book, but negative free cash flow. Toyota sits nicely in the middle of the best-valued companies with healthy free cash flow and a large amount of equity per market cap.
As for return on equity, BMW, General Motors, Nissan, Volkswagen and Renault are moving in the wrong direction. Toyota and Honda have been doing much better at this over the last 2 years.
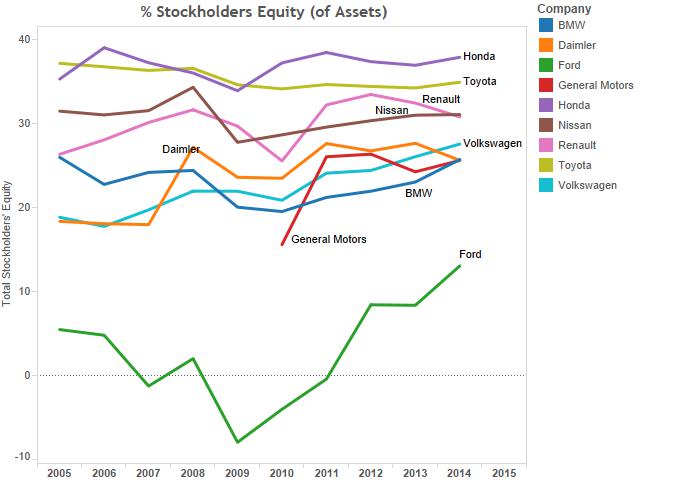
What about shareholder equity as a % of assets? All trends are pointing upwards, especially Ford, which is playing catch-up after surviving the financial crisis. GM has more equity, but probably wants us to forget that it’s shareholders were wiped out in 2008. It got a fresh start where Ford did not.
Putting it all together
So which company combines an attractive valuation, some yield to prove profits aren’t cursory, and a management that seems to know what it’s doing in improving it’s business? These graphs suggest that the “cheapest” car companies by valuation are Renault, Volkswagen, Nissan & Ford. The best-run car company by improving trends is, by far, Toyota. Nissan, Ford, Honda and Volkswagen have been doing well too.
My own recommendation would be to sacrifice “cheap” and go with “best”. The difference in trends between Toyota and the rest is greater than the difference in the various valuation metrics. Toyota never stopped paying dividends during the financial crisis, has the scale to continue producing cars forever, and isn’t out of line with its peers in terms of different valuation ratios. Even though Toyota’s stock price reflects some premium, it’s not enough when compared to its outstanding recent performance generating ever increasing revenues, profits, cash flows & returns.


Leave a Reply